
Questo prodotto usufruisce delle SPEDIZIONI GRATIS
selezionando l'opzione Corriere Veloce in fase di ordine.
Pagabile anche con Carta della cultura giovani e del merito, 18App Bonus Cultura e Carta del Docente
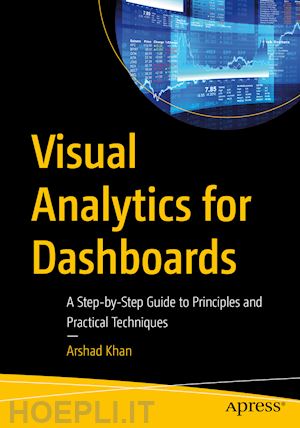
This book covers the key principles, best practices, and practical techniques for designing and implementing visually compelling dashboards. It explores the various stages of the dashboard development process, from understanding user needs and defining goals, to selecting appropriate visual encodings, designing effective layouts, and employing interactive elements. It also addresses the critical aspect of data storytelling, examining how narratives and context can be woven into dashboards to deliver impactful insights and engage audiences.
Visual Analytics for Dashboards is designed to cater to a wide range of readers, from beginners looking to grasp the fundamentals of visual analytics, to seasoned professionals seeking to enhance their dashboard design skills. For different types of readers, such as a data analyst, BI professional, data scientist, or simply someone interested in data visualization, this book aims to equip them with the knowledge and tools necessary to create impactful dashboards.
What you’ll learn
The principles of data visualization
How to create effective dashboards
Meet all the requirements for visual analytics/data visualization/dashboard courses
Deepen understanding of data presentation and analysis
How to use different kinds of tools for data analysis, such as scorecards and key performance indicators
Who This Book Is For
Business analysts, data analysts, BI professionals, end-users, executives, developers, as well as students in dashboards, data visualizations, and visual analytics courses.
Chapter 1: Dashboards.- Chapter 2: Scorecards.- Chapter 3: Key performance indicators.- Chapter 4: Dashboard requirements.- Chapter 5: Dashboard design.- Chapter 6: Data visualization.- Chapter 7: Visualization principles.- Chapter 8: Visual communication.- Chapter 9: Understanding and using charts.- Chapter 10: Selecting charts.- Chapter 11: Best Practices and Tips.
Arshad Khan is a versatile business intelligence/analytics and training professional, with 35+ years of experience, who has led many Tableau and SAP projects. He has consulted for Accenture, PwC, Deloitte, Chevron, Bose Corporation, Daimler Chrysler, Genentech, PepsiCo, Hitachi-America, and many other blue-chip companies.
Khan has authored 17 books including six on business intelligence. He has taught many data visualization, dashboards, data analysis, BI, and SAP courses at 9 universities including Golden Gate University, Santa Clara University, and the University of California (Berkeley, Santa Cruz/Silicon Valley, and San Diego Extensions). Mr. Khan has a graduate degree in chemical engineering and an MBA.


Il sito utilizza cookie ed altri strumenti di tracciamento che raccolgono informazioni dal dispositivo dell’utente. Oltre ai cookie tecnici ed analitici aggregati, strettamente necessari per il funzionamento di questo sito web, previo consenso dell’utente possono essere installati cookie di profilazione e marketing e cookie dei social media. Cliccando su “Accetto tutti i cookie” saranno attivate tutte le categorie di cookie. Per accettare solo deterninate categorie di cookie, cliccare invece su “Impostazioni cookie”. Chiudendo il banner o continuando a navigare saranno installati solo cookie tecnici. Per maggiori dettagli, consultare la Cookie Policy.