
Questo prodotto usufruisce delle SPEDIZIONI GRATIS
selezionando l'opzione Corriere Veloce in fase di ordine.
Pagabile anche con Carta della cultura giovani e del merito, 18App Bonus Cultura e Carta del Docente
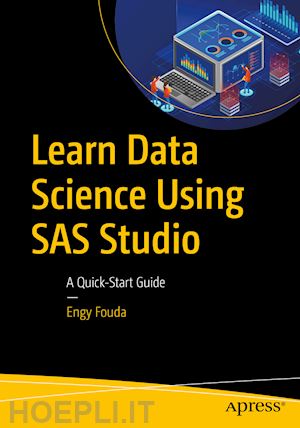
Do you want to create data analysis reports without writing a line of code? This book introduces SAS Studio, a free data science web browser-based product for educational and non-commercial purposes. The power of SAS Studio comes from its visual point-and-click user interface that generates SAS code. It is easier to learn SAS Studio than to learn R and Python to accomplish data cleaning, statistics, and visualization tasks.
The book includes a case study about analyzing the data required for predicting the results of presidential elections in the state of Maine for 2016 and 2020. In addition to the presidential elections, the book provides real-life examples including analyzing stocks, oil and gold prices, crime, marketing, and healthcare. You will see data science in action and how easy it is to perform complicated tasks and visualizations in SAS Studio.
You will learn, step-by-step, how to do visualizations, including maps. In most cases, you will not need a line of code as you work with the SAS Studio graphical user interface. The book includes explanations of the code that SAS Studio generates automatically. You will learn how to edit this code to perform more complicated advanced tasks. The book introduces you to multiple SAS products such as SAS Viya, SAS Analytics, and SAS Visual Statistics.What You Will Learn
Who This Book Is For
A general audience of people who are new to data science, students, and data analysts and scientists who are experiencedbut new to SAS. No programming or in-depth statistics knowledge is needed.
Part 1: Basics.- Chapter 1: Data Science in Action.- Chapter 2: Getting Started.- Chapter 3: Data Visualization.- Part 2: More Programming.- Chapter 4: Statistical Analysis and Linear Models.- Chapter 5: Advanced Data Preprocessing.- Chapter 6: Preparing Data for Analysis.- Part 3: Advanced Topics.- Chapter 7: Regression.- Chapter 8: SAS Visual Statistics – Viya.- Chapter 9: What Is Next?.- Appendix: Resources.-
Engy Fouda is an author, freelance engineer, and journalist. She also is a freelance instructor and teaches SAS, Docker Fundamentals, Docker for Enterprise Developers, Docker for Enterprise Operations, and Kubernetes. Engy holds two master's degrees, one in journalism from Harvard University, Extension School, and another in computer engineering from Cairo University, Egypt. She earned the Data Science Professional Graduate Certificate from Harvard University, Extension School. She volunteers as the Team Lead for Momken Group (Engineering for the Blind), Egypt Scholars Inc. The team designs and manufactures devices and develops Arabic applications for visually impaired people in the MENA region. Engy volunteers as a Member-at-Large and as newsletter editor of the IEEE Mid-Hudson section. And she published several books that made Amazon's best-selling charts for Arabic books.


Il sito utilizza cookie ed altri strumenti di tracciamento che raccolgono informazioni dal dispositivo dell’utente. Oltre ai cookie tecnici ed analitici aggregati, strettamente necessari per il funzionamento di questo sito web, previo consenso dell’utente possono essere installati cookie di profilazione e marketing e cookie dei social media. Cliccando su “Accetto tutti i cookie” saranno attivate tutte le categorie di cookie. Per accettare solo deterninate categorie di cookie, cliccare invece su “Impostazioni cookie”. Chiudendo il banner o continuando a navigare saranno installati solo cookie tecnici. Per maggiori dettagli, consultare la Cookie Policy.